Microsoft Sentinel: Process Hollowing T1055.012 Analysis
In this article, we are going to explore a technique called Process Hollowing.
Before jumping into the detection part, it is essential to explore some important terminologies.
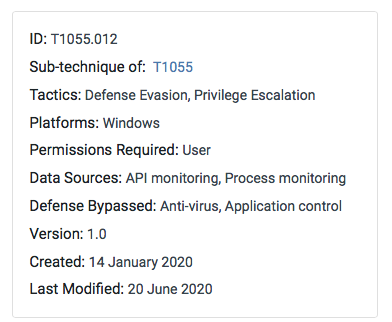
According to MITRE:
"Process hollowing (T1055.012) is commonly performed by creating a process in a suspended state then unmapping/hollowing its memory, which can then be replaced with malicious code. A victim process can be created with native Windows API calls such as CreateProcess, which includes a flag to suspend the processes primary thread. At this point the process can be unmapped using APIs calls such as ZwUnmapViewOfSection or NtUnmapViewOfSection before being written to, realigned to the injected code, and resumed via VirtualAllocEx, WriteProcessMemory, SetThreadContext, then ResumeThread respectively"
To learn more about Process hollowing, i highly recommend you to check this piece from Elastic: https://www.elastic.co/blog/ten-process-injection-techniques-technical-survey-common-and-trending-process
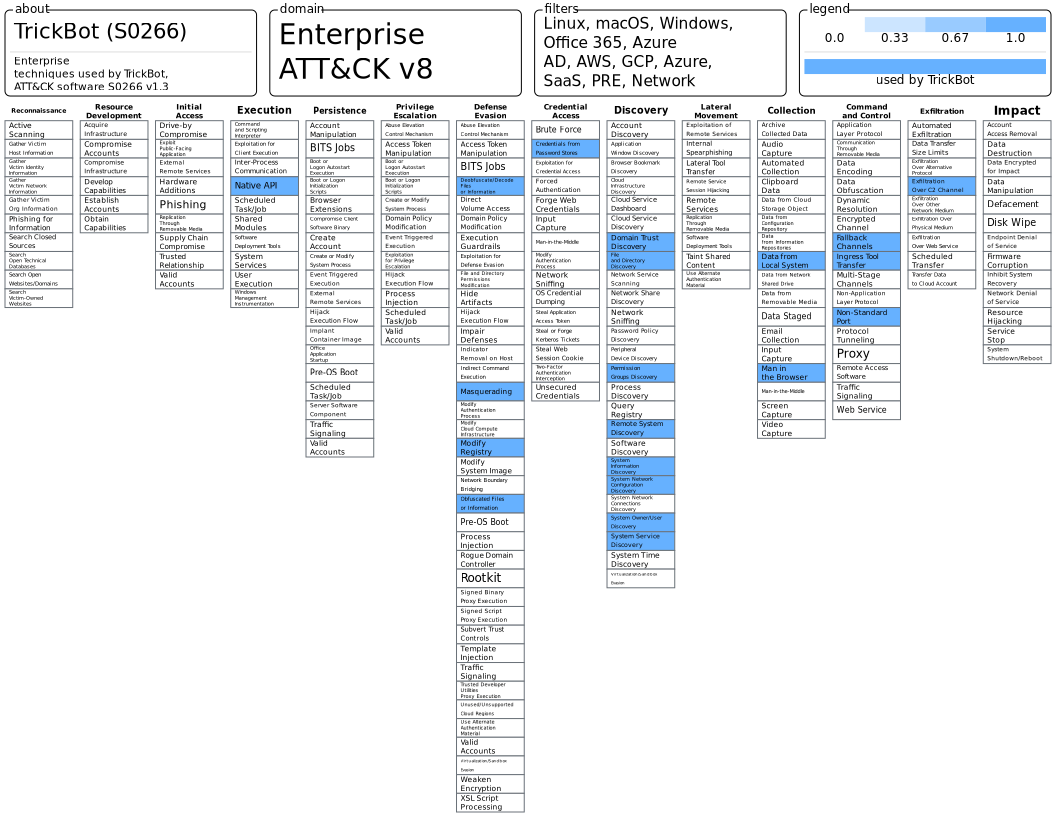
This technique is widely used by adversaries such as Duqu and TrickBot
The following pieces by Jonathan Johnson and David Polojac from Specterops deep dive into the detection engineering aspects of process hollowing
- Engineering Process Injection Detections - Part 1: Research
- Engineering Process Injection Detections — Part 2: Data Modeling
- Engineering Process Injection Detections — Part 3: Analytic Logic
For the detection we are going to use Azure Sentinel and sysmon. Sysmon can be downloaded from here:
https://docs.microsoft.com/en-us/sysinternals/downloads/sysmon
To install it, run the following command as an administrator:
sysmon.exe -accepteula -i <CONFIG_FILE_HERE>
You can use the following config file by ION-STORM:
https://github.com/ion-storm/sysmon-config
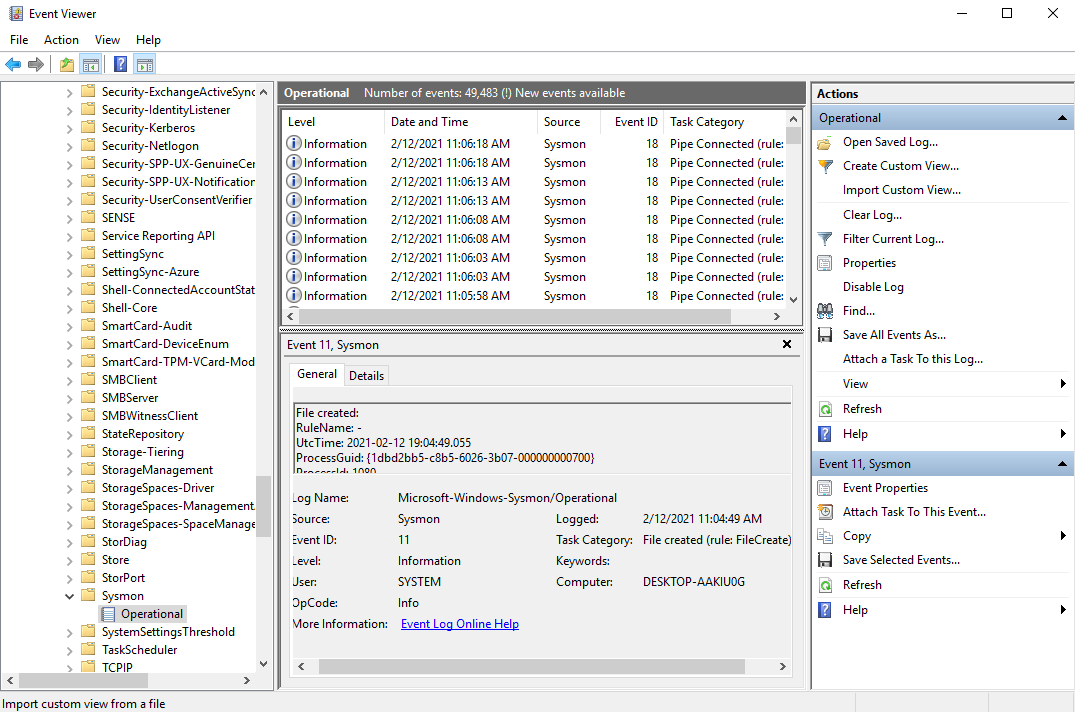
To explore sysmon events, use Windows Event Viewer: Applications and services logs -\> Microsoft -\> Windows -\> Sysmon -\> Operational
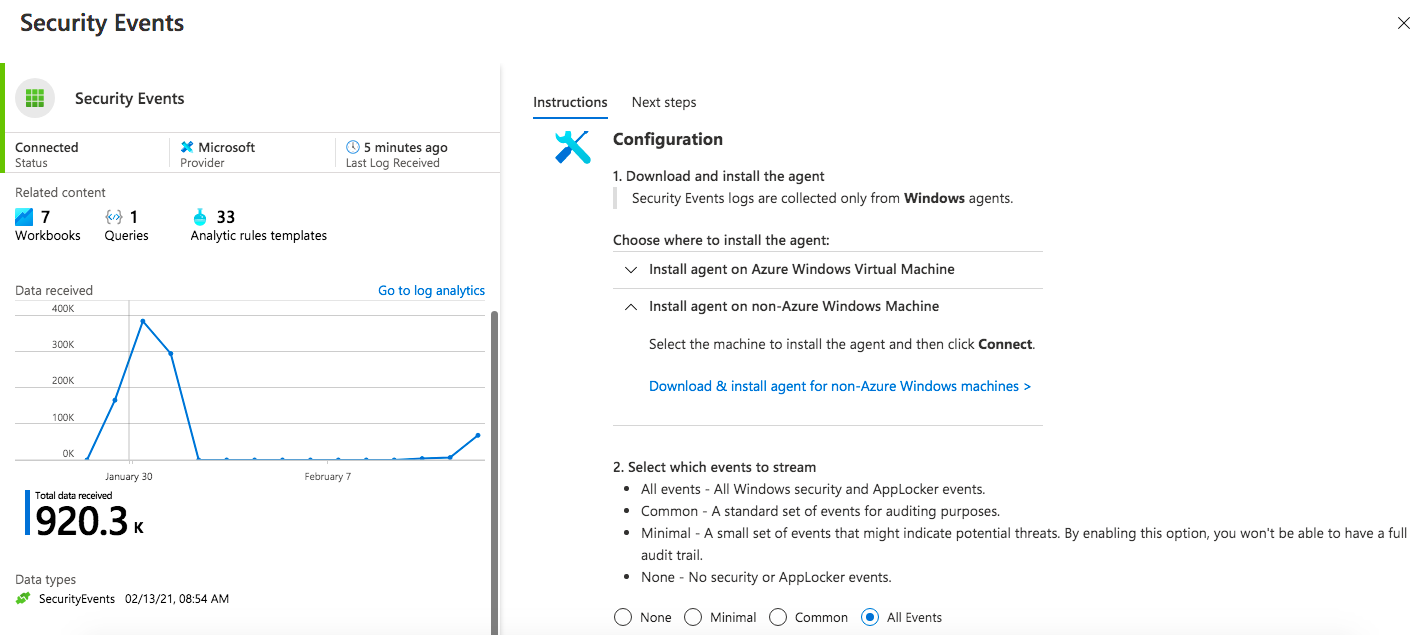
To send sysmon events to Azure sentinel, deploy a new connector (Security Events) to start with Windows Event logs
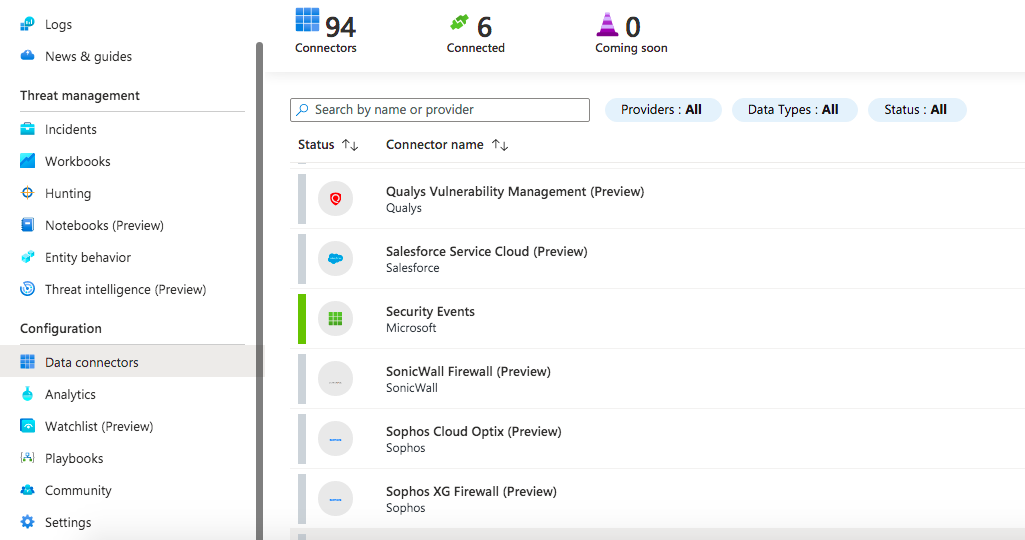
Install the agent.
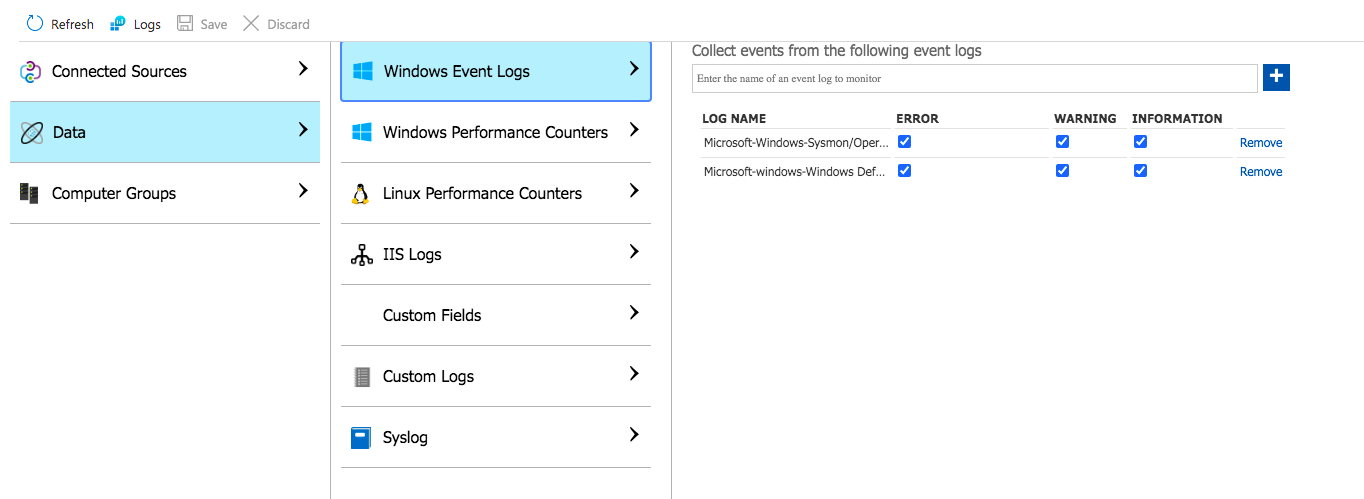
Now go to Settings -\> Workspace Settings -\> Advanced settings -\> Data -\> Windows Event Logs and add the following event log name: Microsoft-Windows-Sysmon/Operational
To check the events go to Azure Sentinel Logs section and run the following query:
Event
| where Source == "Microsoft-Windows-Sysmon"
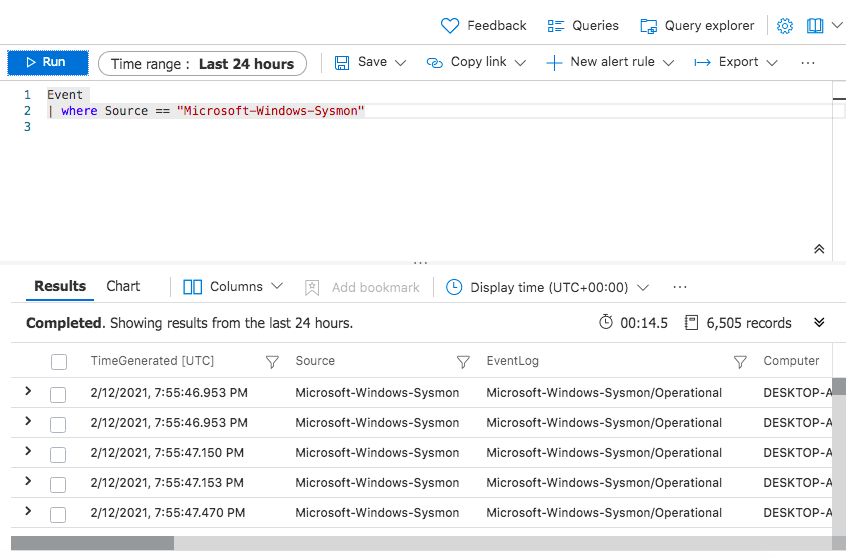
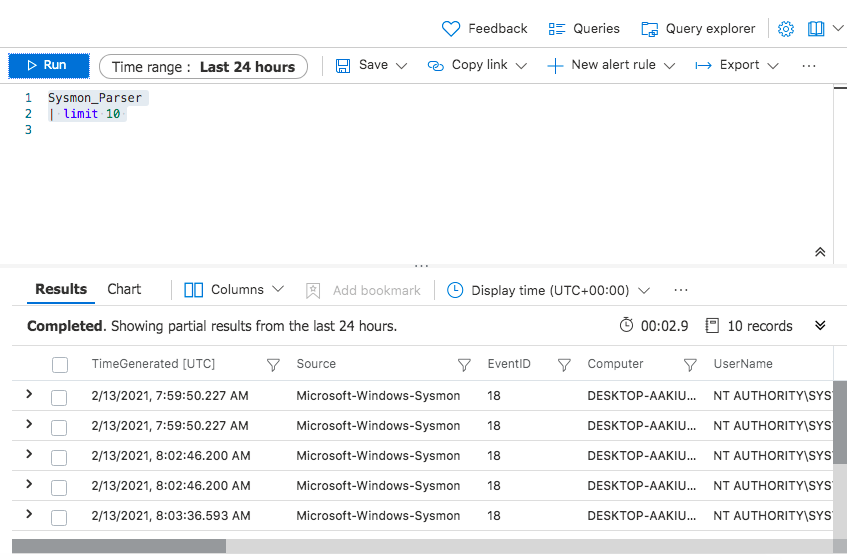
As you will notice the EventData fields are not parsed and filtered. Thus, it is recommended to use one of Azure Sentinel sysmon parsers: https://github.com/Azure/Azure-Sentinel/tree/master/Parsers/Sysmon
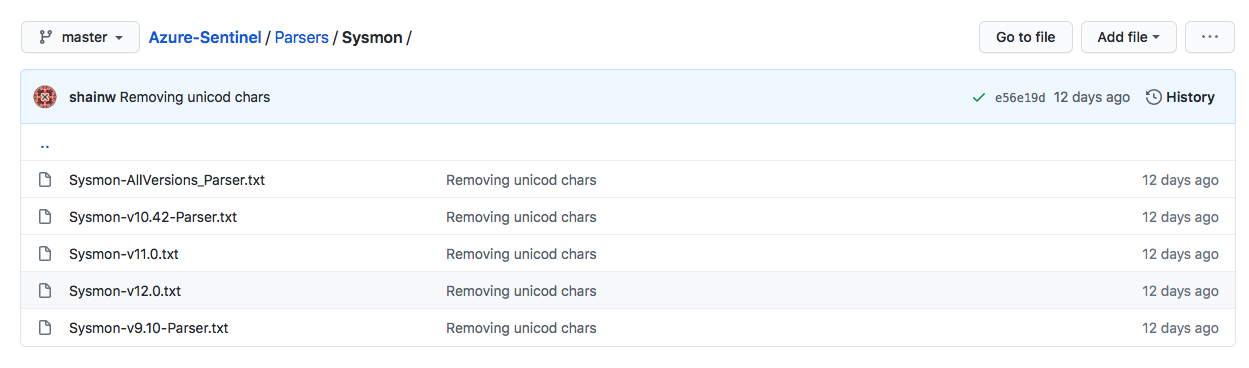
To use the parser, copy the file content in log analytics and save it as a function (e.g Sysmon_Parser). Now the events are well parsed:
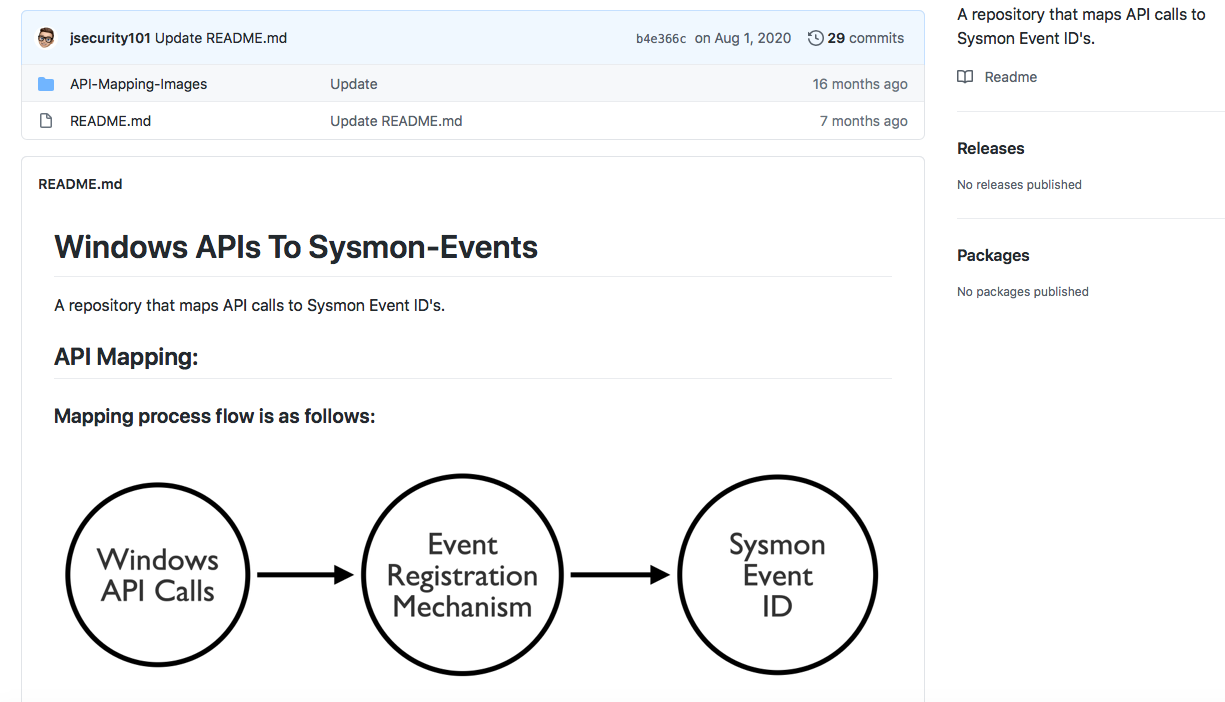
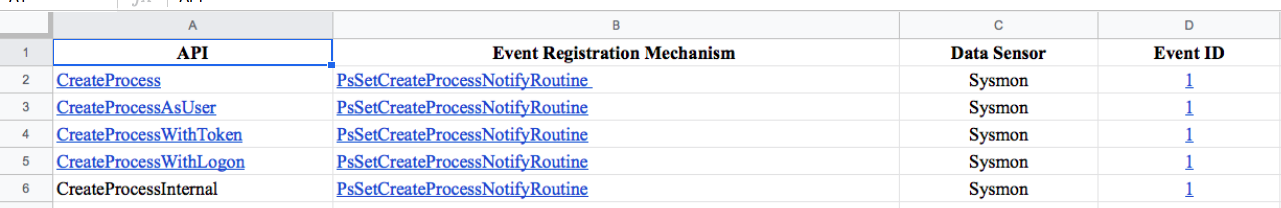
To correlate APIs with Events, a mapping phase is needed for a better visibility. Thankfully, you can use these sheets:
- https://github.com/hunters-forge/API-To-Event
- https://github.com/jsecurity101/Windows-API-To-Sysmon-Events
More details about mapping can be found here: Uncovering The Unknowns
Now we know what sysmon EventIDs to watch
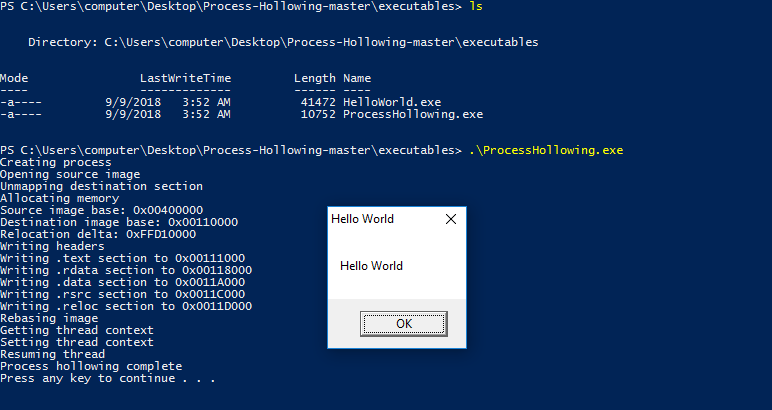
Let's perform a process hollowing technique using the following poc: https://github.com/m0n0ph1/Process-Hollowing
Go to Azure Sentinel logs console
Sysmon_Parser
| where EventID in ("1","10")
| project SourceImage, TargetImage, EventID, GrantedAccess
- EventID 1: Process Created
- EventID 10: Process Accessed
- The project operator: Only the columns specified in the arguments are included in the result.
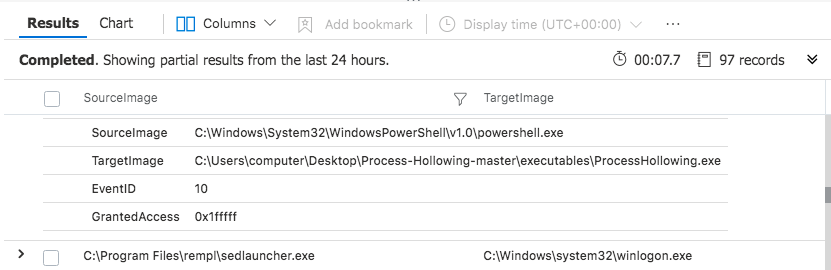
In our case, the access rights used by the POC is 0x1fffff which is PROCESS_ALL_ACCESS even though according to Jonathan Johnson's research process hollowing only needs the following rights:
PROCESS_VM_WRITE
PROCESS_VM_OPERATION
PROCESS_SUSPEND_RESUME
PROCESS_CREATE_PROCESS